Animated Path for Interactive Storytelling
This tutorial will show you how to create an interactive path, that leads to a certain destination whilst scrolling down into the fold.
Why animate a path?
Every great design begins with an even better story.
Everybody knows how a map uses a path that connects the starting point with the destination. Usually these paths are highlighted in a special colour, like blue or red but that's it. Wouldn't it be interesting, if we could implement this path into our story, that reacts in an interactive way to the scroll behaviour of the user?
The further the user scrolls into the story, the more the path will wander towards its destination, with highlights throughout the course. It will appear intriguing and animates whoever is reading that text to proceed. As if the reader travels along the path him-/herself. So the real question is: Why shouldn't we animate a path?
The Beginnings
Before we start, we want to tell you about some tools, that you will wind up needing for fulfilling this tutorial:
This tutorial will work with your common standard browsers such as Firefox, Chrome and Safari. Be careful, if you use any other browsers than the mentioned ones, because the performance of the animation could differ.
Further on you will need the following tools in order to create an animated path:
- Adobe Illustrator (or similar programs) for creating SVG's and your map
- Studio Visual Code (or similar coding assistants)
- YouTube or other external help, if you need it
... on we go.
Now we want to hook you up with everything you need to build that tutorial so the outcome will sorta look like this:
It appears to be quite easy on first sight, we have to admit, but implying it into a fully working little webpage, it takes a bit more than just a few lines of code. But don't worry! We coded everything for you, so we can only deal with the most important bits of creating an animated interactiv path!
If you click one of the following Buttons you will get a zip-file that contains a folder with codes for HTML, CSS and JavaScript and the corresponding images in each of them. Obviously your go-to button is the one, that says "Tutorial". But please don't hesitate to always sneak-peak into the solutions, if you need a little hint.
Tutorial SolutionsLets talk SVG!
SVG's (Scalable Vector Graphics) are what we need to create an animated path that contains points of interests. So before we get to the coding part, we first need to create SVG's that function as a path and as a map.

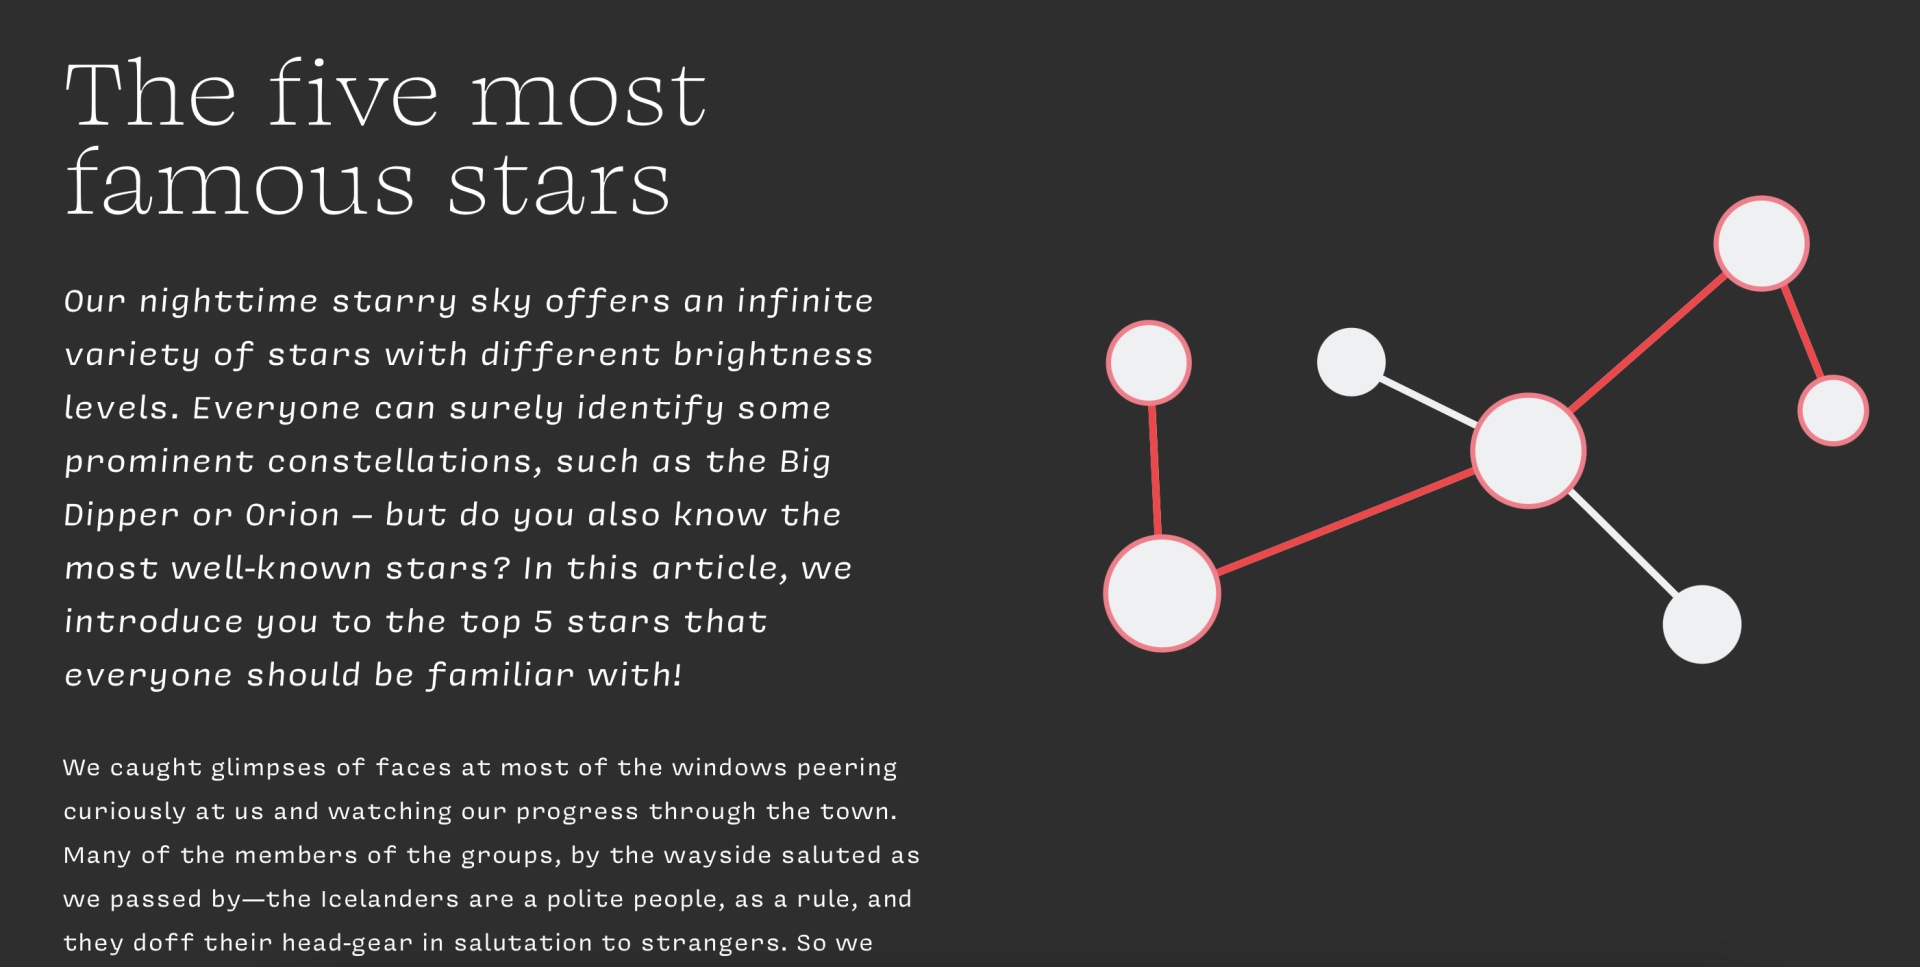
As you can see, your whole map can be created in Illustrator. It might requires a bit of dexterity if you are new to such programs, but with simple tools like the circle or path tool this little scheme here can be easily built. Of cours you could also grab the SVG code out of the Solutions-Folder.
For those who built this little star map theirselves, make sure you give the points and the path logic and simple names.
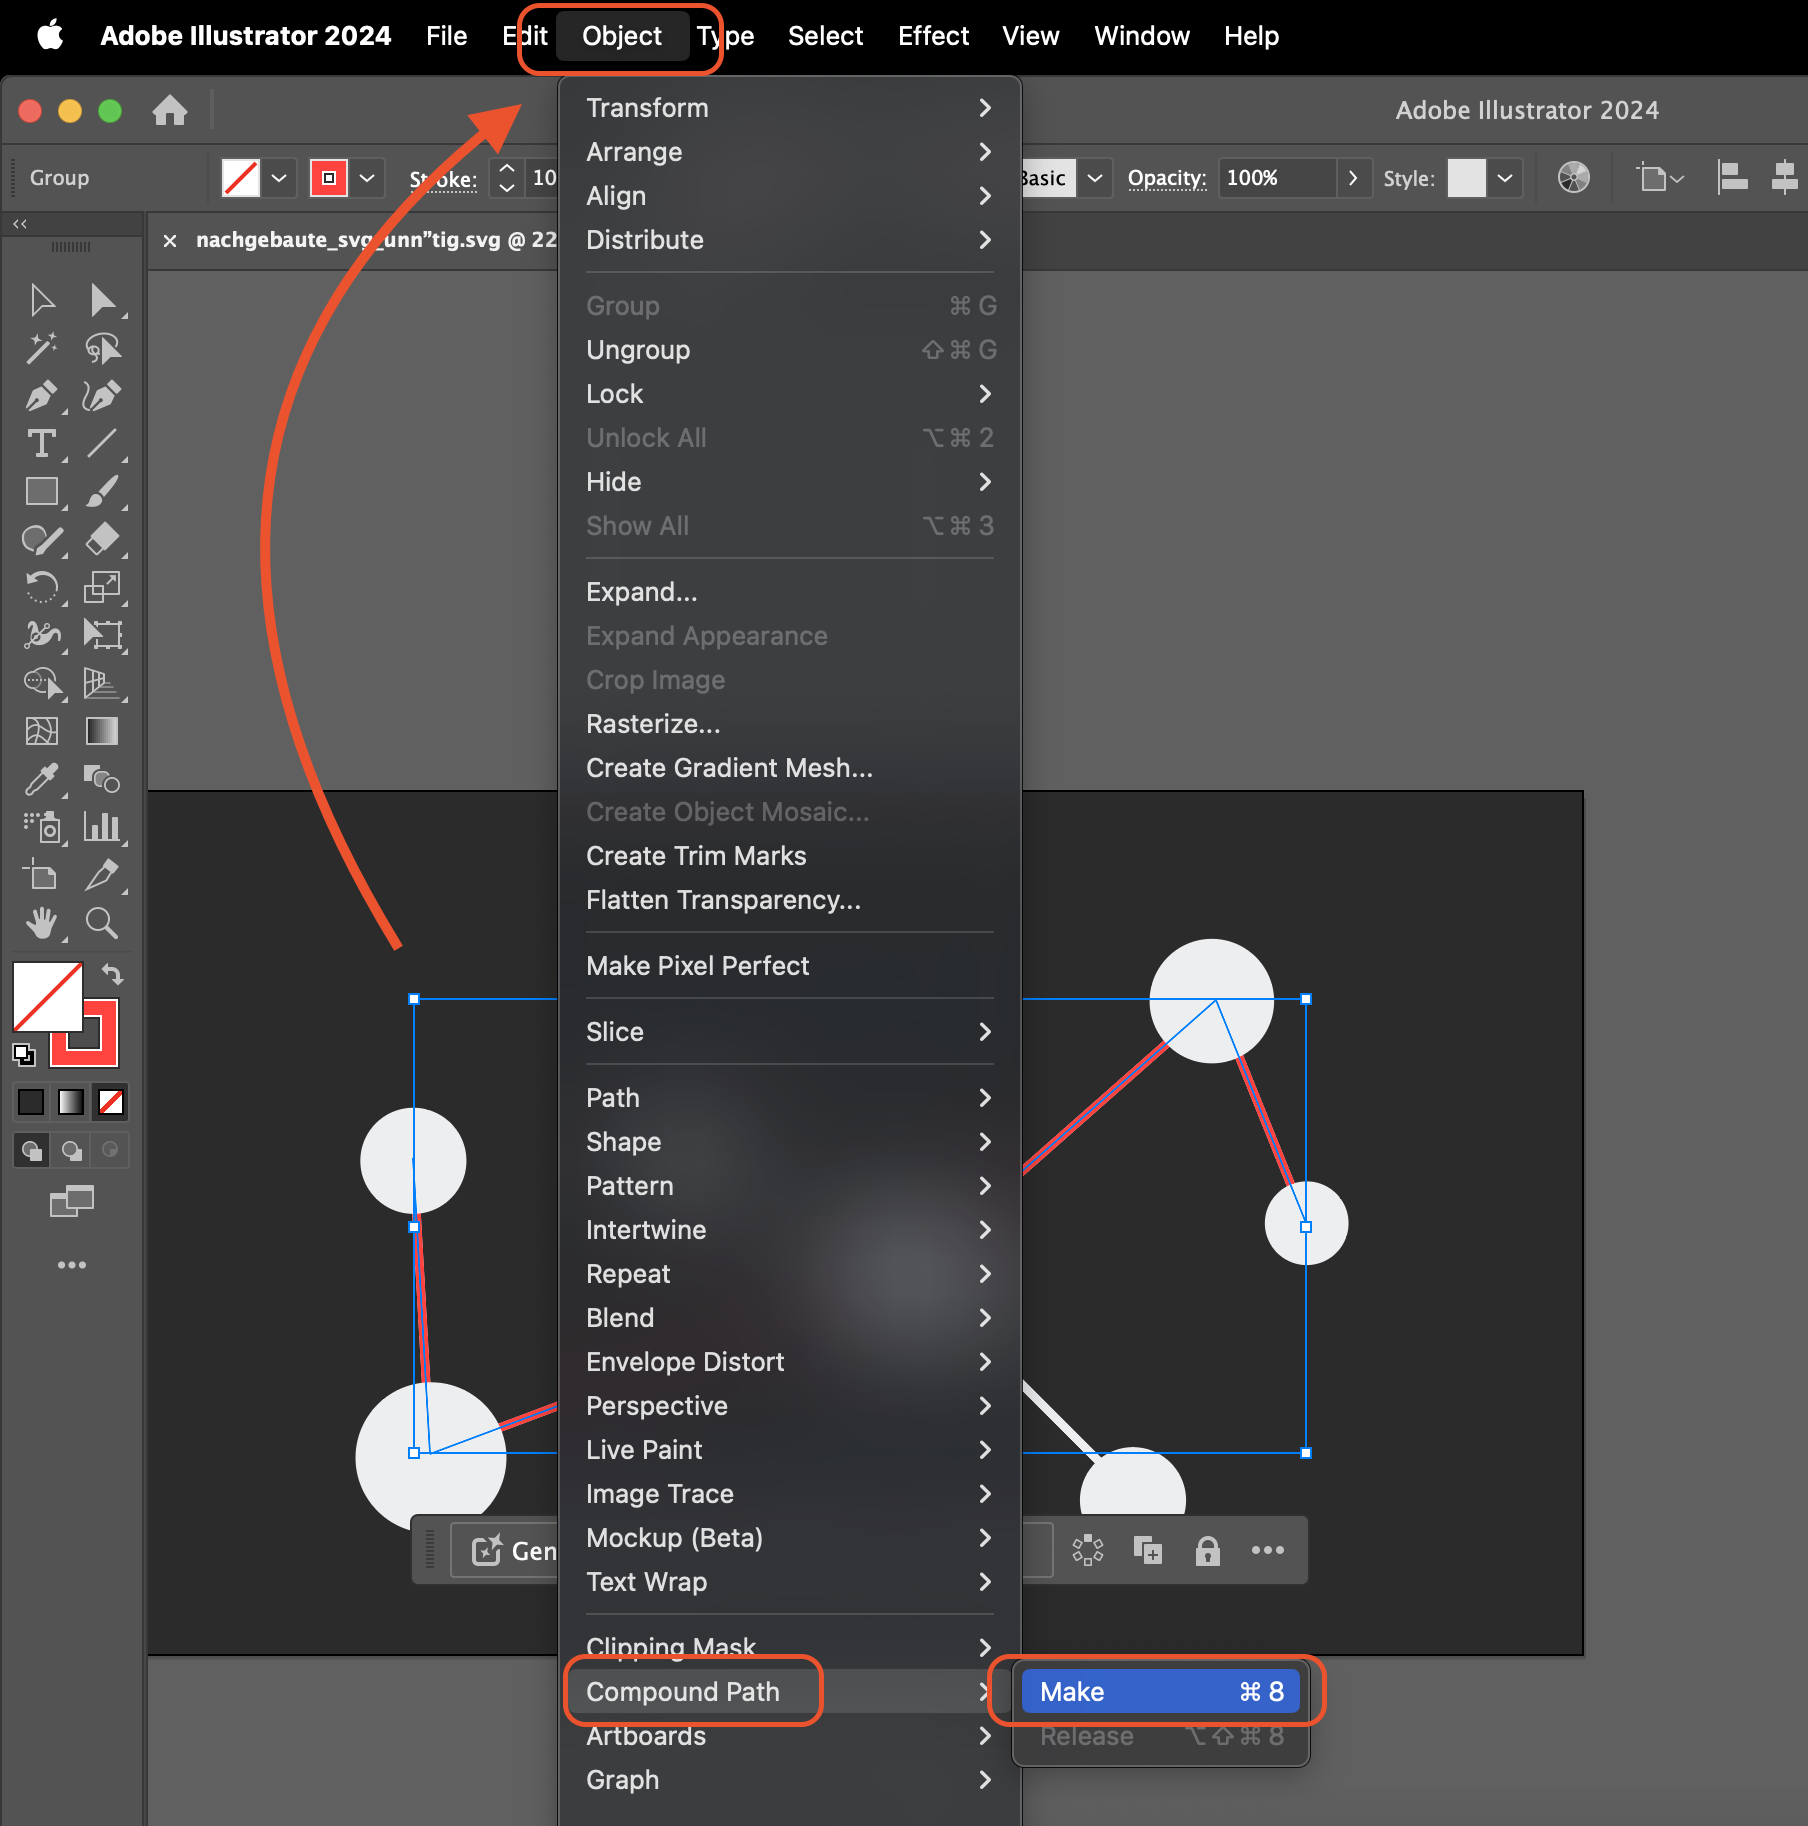
If you work in Illustrator make sure to create a <compound path> out of your path. This is how you do it:

So the red path will be our animated path that will appear through scrolling into the fold, and the white dots are going to be our points of interest. You can always use any mackground you like for your map it can only be you may have to readjus certain parameters in the code to make it match to your new SVG.
Care: Make sure your created a <path> and nothing like a <line> or a <polygon> !
Once you managed to create your own little map and double checked the names of the elements, you can export it as a SVG to your Folder.
It belongs to the Folder named "img" and we shall call it starmap.svg
Correct semantic names and getting a feeling for naming your SVG elements will help you later through out the code to not missspell anything that might ends up fatal for the codes function.
Great! The last elementary thing we need is a JavaScript document, which we can easily create in Studio Visual Code. We will call it: script.js
Implement it in your head, so it should (depending on the location you put it in) look like this:
<head>
	<meta charset="UTF-8" />
	<meta http-equiv="X-UA-Compatible" content="IE=edge">
	<meta name="viewport" content="width=device-width, initial-scale=1.0, maximum-scale=1.0, user-scalable=no">
	<title> Animated Path Tutorial</title>
	<meta name="keywords" content=" animated, path, story, tutorial, canvas, web design, interactive" />
	<link rel="stylesheet" type="text/css" href="css/style.css" />
	<link rel="stylesheet" href="https://use.typekit.net/kfa3jdv.css">
	<script src="../src/script.js"></script> //we put it in a sub-folder named "src"
</head>
Cleaning up the SVG's
Let's open up the SVG code and let's delete some styles and classes – they're currently not necessary, and we only need the basics for now. Go ahead and delete them, and watch what happens in your browser.
Now you will have to define your path and the points in your code. This could for example look like this:
<circle id="point5" class="stern" display="inline" fill='#EFF0F2' cx="1703.9" cy="525.1" r="32.2"/>All our points of interest summed up in the SVG code look like this:
<g id="Points_of_Interest">
				<circle id="point0" class="stern" display="inline" fill='#EFF0F2' cx="1041" cy="478.9" r="39.1"/>
				<circle id="point1" class="stern" display="inline" fill='#EFF0F2' cx="1041" cy="478.9" r="39.1" stroke='#FF7788' stroke-width='5'/>
				<circle id="point2" class="stern" display="inline" fill='#EFF0F2' cx="1053.9" cy="702.2" r="54.7" stroke='#FF7788' stroke-width='5'/>
				<circle id="point3" class="stern" display="inline" fill='#EFF0F2' cx="1408.6" cy="564.1" r="53.9" stroke='#FF7788' stroke-width='5'/>
				<circle id="point4" class="stern" display="inline" fill='#EFF0F2' cx="1634.5" cy="363.3" r="44.1" stroke='#FF7788' stroke-width='5'/>
				<circle id="point5" class="stern" display="inline" fill='#EFF0F2' cx="1703.9" cy="525.1" r="32.2" stroke='#FF7788' stroke-width='5'/>
</g>
If you haven't noticed already, we've introduced an additional point labeled '0' by duplicating the initial point and modifying its ID to 'point0.' This strategic duplication serves a purpose – it acts as a 'Dummy-Point,' orchestrating a delayed start for the animation.
Not only this but also did we add a little beauty-correction, that smoothens out the appearance of the points by giving them a light red stroke with the width of '5'.
For the path we also did some adjustments. We gave it our own colour of choice, which would be here the websites signature color: #FF3344
Also make sure it has fill='none' and the stroke-width='7'
<g id="trail-path">
<path display="inline" fill='none' stroke='#FF3344' stroke-width='7' d="M1691.9,493.3L1638,359.4c0,0-218.7,193.4-231.7,202.1c-12.9,8.7-353.6,142.2-353.6,142.2l-8.8-182.7"/>
</g>
The complete SVG code will be implemented in your HTML document:
<!DOCTYPE html>
<html lang="en">
<head>
	<meta charset="UTF-8" />
	<meta name="viewport" content="width=device-width, initial-scale=1.0, maximum-scale=1.0, user-scalable=no">
	<title> Animated Path Tutorial</title>

</head>

<body>

		<!--Svg Anfang -->

<div class="starmap">
<svg version="1.1" xmlns="http://www.w3.org/2000/svg" xmlns:xlink="http://www.w3.org/1999/xlink" x="0px" y="0px"
			 viewBox="0 0 1920 1080" style="enable-background:new 0 0 1920 1080;" >
			<g id="Background_Image">
				<circle id="5" fill='#EFF0F2' cx="1704.4" cy="525.7" r="32.2"/>
				<circle id="4" fill='#EFF0F2' cx="1634.9" cy="363.9" r="44.1"/>
				<circle id="3" fill='#EFF0F2' cx="1409.1" cy="564.6" r="53.9"/>
				<circle id="2" fill='#EFF0F2' cx="1054.4" cy="702.8" r="54.7"/>
				<circle id="1" fill='#EFF0F2' cx="1041.4" cy="479.5" r="39.1"/>
				<circle id="6" fill='#EFF0F2' cx="1237.2" cy="478.1" r="33.2"/>
				<circle id="7" fill='#EFF0F2' cx="1576.9" cy="732.3" r="38.1"/>
				<path fill='none' stroke='#EFF0F2' stroke-width='7' stroke-linecap='round' d="M1691.9,493.3L1638,359.4c0,0-218.7,193.4-231.7,202.1c-12.9,8.7-353.6,142.2-353.6,142.2L1044,521"/>
				<path fill='none' stroke='#EFF0F2' stroke-width='7' stroke-linecap='round' d="M1258.8,490.5l150.3,74.1c12.2,9.7,153.6,150.7,153.6,150.7"/>
			</g>
			<g id="trail-path">
				<path display="inline" fill='none' stroke='#FF3344' stroke-width='7' d="M1691.9,493.3L1638,359.4c0,0-218.7,193.4-231.7,202.1c-12.9,8.7-353.6,142.2-353.6,142.2l-8.8-182.7"/>
			</g>
			<g id="Points_of_Interest">
				<circle id="point0" class="stern" display="inline" fill='#EFF0F2' cx="1041" cy="478.9" r="39.1"/>
				<circle id="point1" class="stern" display="inline" fill='#EFF0F2' cx="1041" cy="478.9" r="39.1" stroke='#FF7788' stroke-width='5'/>
				<circle id="point2" class="stern" display="inline" fill='#EFF0F2' cx="1053.9" cy="702.2" r="54.7" stroke='#FF7788' stroke-width='5'/>
				<circle id="point3" class="stern" display="inline" fill='#EFF0F2' cx="1408.6" cy="564.1" r="53.9" stroke='#FF7788' stroke-width='5'/>
				<circle id="point4" class="stern" display="inline" fill='#EFF0F2' cx="1634.5" cy="363.3" r="44.1" stroke='#FF7788' stroke-width='5'/>
				<circle id="point5" class="stern" display="inline" fill='#EFF0F2' cx="1703.9" cy="525.1" r="32.2" stroke='#FF7788' stroke-width='5'/>
			</g>
		</svg>
		</div>

		<!--Svg Ende-->
If you had a background in your SVG file it will also be displayed in the SVG code. You can edit it the same way and adjust it to your personal likings, as you did with the path and the points of interest.
What do we have so far?

We have our graphic and we have the path, so what is missing is the animation.
Time for Script
This is the part, where the magic happens: JavaScript code.
We are going to jump a bit more focused through this part of the tutorial:
To starting our script code with the Event Listener for "DOMContentLoaded". It'll make sure, that the code would only start to run when the HTML document tree has loaded completely.
document.addEventListener("DOMContentLoaded", function () {Selecting Elements from the DOM
The "starmapPath" is a special path that we're using to guide something on our webpage. It's inside an area with the ID 'trail-path.'
"sections" are like different parts or chapters in our webpage. They have the class 'js-section', making it easy to organize and follow along.
And last but not least our "points" are the points of interest we've marked on our webpage. All the points are collected using the variable 'points' which gathers all the circle elements inside the area with the ID 'PointsofInterest.' These points add details to our animated path, making it visually interesting.
var starmapPath = document.querySelector("#trail-path path");
var sections = document.querySelectorAll(".js-section");
var points = document.querySelectorAll("#Points_of_Interest circle");
Initializing Path Length and Animation Effects
This code calculates the total length of the path, and then it sets the properties strokeDasharray and strokeDashoffset of the path to establish animation details.
var pathLength = starmapPath.getTotalLength();
starmapPath.style.strokeDasharray = pathLength;
starmapPath.style.strokeDashoffset = pathLength;
Initializing the Points and their States
Here, the points are initialized by defining their color, transition properties, and transforms. The first point is presented differently to emphasize it.
Initializing the Active Point Index
This code snippet establishes a variable called activePointIndex and initializes it with a value of -1. The purpose of this variable is to keep track of the index of the active point, which corresponds to the visible section of the webpage.
var activePointIndex = -1;Setting the Initial State of the Points
This code snippet retrieves the zoom starting value of the first section. Then, it initiates a loop over all the points.
var initialZoomStart = parseFloat(sections[0].getAttribute("data-zoom-start"));
points.forEach(function (point, index) {
    // ...
});
Initializing the State of Each Point
- initialOffset: The initial offset of the path is calculated based on the zoom start value.
- point.style.fill: The color of each point is set. The first point is filled with "#FF7788" (light red) while others get "#EFF0F2." (light grey)
- point.style.transition: A CSS transition property is set to ensure smooth color and transformation changes.
- starmapPath.style.strokeDashoffset: The initial state of the path is defined.
- point.style.transformOrigin and point.style.transform: The origin of the transformation and the scaling of the points are established. The first point is scaled by 10% to highlight it.
var initialOffset = pathLength - pathLength * initialZoomStart;
point.style.fill = index === 0 ? "#FF7788" : "#EFF0F2";
point.style.transition = "fill 0.3s ease-in-out, transform 0.3s ease-in-out";
starmapPath.style.strokeDashoffset = initialOffset;
point.style.transformOrigin = "center center";
point.style.transform = index === 0 ? "scale(1.1)" : “scale(1)";
Creating a Function to Handle Scrolling
This is a function that gets called when the document is scrolled. It changes the display of the Starmap and the points based on the scrolling behavior, which is exactly, what we want.
function handleScroll() {
  // ... (Code zur Verarbeitung des Scrollens)
}
Calculation of Scroll Percentage
This line calculates the current scroll percentage. window.scrollY represents the current vertical scroll position, and the percentage is calculated relative to the total height of the document minus the visible window height.
var scrollPercentage = window.scrollY / (document.documentElement.scrollHeight - window.innerHeight);Determining the Current Section by Scrolling
The current section in the HTML is determined based on the calculated percentage and the number of sections on the page. Math.floor is used to round the index to the nearest whole number.
var currentSectionIndex = Math.floor(scrollPercentage * sections.length);Calculation of the Zoom Start Value for the Current Section
The zoom start value for the current section is retrieved from the data attribute data-zoom-start of the current section - also to be found in the HTML, right behind the classification of the section.
var zoomStart = parseFloat(sections[currentSectionIndex].getAttribute(“data-zoom-start”));Adjusting the Position of the Starmap Path
This line adjusts the position of the Starmap Path based on the calculated zoom start value.
starmapPath.style.strokeDashoffset = pathLength - pathLength * zoomStart;Resetting All Points to the Original Color and Size
All points are reset to their original color (#EFF0F2) and size (scale(1)).
points.forEach(function (point) {
  point.style.fill = "#EFF0F2";
  point.style.transform = "scale(1)";
});
Checking the Current Section and Applying Changes for the Corresponding Point
This part of the code checks whether the current section index is within the bounds of the existing points. If yes, it changes the light red color of the corresponding point (#FF7788) and applies a slight zoom effect (scale(1.001)). Otherwise, the active point index is reset as no matching section was found.
This creates the highlighting effect, that we wittness whilst we reach a point of our interest whilst scrolling.
if (currentSectionIndex >= 0 && currentSectionIndex < points.length) {
  // Apply color change and zoom effect for the corresponding point
  activePointIndex = currentSectionIndex;
  var currentPoint = points[activePointIndex];
  currentPoint.style.fill = "#FF7788";
  currentPoint.style.transform = "scale(1.001)";
} else {
  // No section found, reset the active point
  activePointIndex = -1;
}
Adding an Event Listener for Scrolling and Setting the Initial State
This part of the code adds the handleScroll event listener for scrolling, and the function is also called once to set the initial state.
window.addEventListener("scroll", handleScroll);
handleScroll();
You did it!
Congratulations! You've successfully navigated through our tutorial on animating paths. Armed with this newfound knowledge, you now have the power to bring motion and life to your web creations.
Here are a few things we want to give you on the road in case you encounter a few problems:
Tips and Tricks
- If the animation seems to "go the wrong way" check if your points and paths have the right positions and orders in your SVG and HTML.
- Sometimes playful experimenting is required to just hit the right spot
- In case you cant solve your problem, there are plenty of great YouTube tutorials or AI's that can provide good solutions - don't give up!
Sadly this tutorial isn't responsive yet. If you want to apply this feature into one of your projects, make sure to take care of a proper responsiveness.
This tutorial was inspired by Tympanus.net - Storytellling Map
Back to Top


